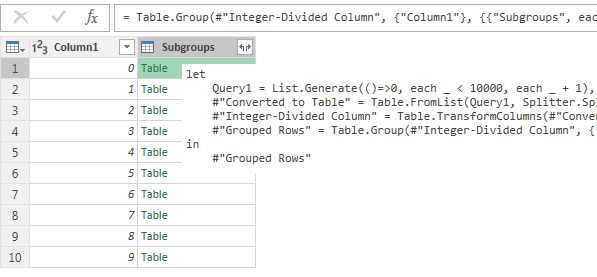
Pic. Pivot Text to Column we need an intermediary number column ---- List.Generate + GroupByAllRows
https://youtu.be/LiDYLSxQTmQ?t=2252 Parameters: Filter Country at File-opening
Pic. The structure (Source) Pic. DataTables = FlowTables and LookupTables = ResourceTables (Source) Pic. The Lookup/ResourceTables holds the attributes (adjective/adverb) for the Process.
Pic. Sales & Budget Pic. Useful ----- Co-operative rules/formulas/procedures: each person is an object with several attributes. The co-operative procedures are 'context specific'. Example two men in a rowing boat can co-operate to row in the same direction. The contextual target/objective is to get ashore. The limiting constraints may be that one have a broken arm. So with least input, considering the constraints, get most output. The limiting constraints includes satisfaction based on dissatisfaction (or utility* based on dis-utility). Happiness of the many does not out-weight the sorrows of the few. The right behaviours from rewards/motivations;things that moves us. * Value dimension can be more/less. Source: link Social business --> 'human entities' attributes
Choose a granularity that is understandable, and actionable
How to do with; Values/Dimensions a) Missing, Errors, Outliers, ? Repair or Disregard ? b) Too many categories, change ordinal categories to values, avoid collinearity issues, Source: link The curse of dimensionality Even millions images are not really big in the context of the curse of dimensionality. The Predictive power reduces as the Dimensionality increases, known as the Hughes effect.
"Even in the simplest case of d binary variables, the number of possible combinations already is O(2d), exponential in the dimensionality. Naively, each additional dimension doubles the effort needed to try all combinations."
Separate between the Known and the Unknown.
The Known (defined) can be Something or Nothing.
The Unknown (undefined) can Null (undefined) or Error (something we tried to define but failed)
The known can be a scalar (numerical) or a category/class (non-numerical).
Numerical Nothing is 0, something is <> 0.
Non-numerical Nothing can be (if text) "", and something is <>"".
"Often, the individual observations are analyzed into a set of quantifiable properties, known variously as explanatory variables or features. These properties may variously be categorical (e.g. "A", "B", "AB" or "O", for blood type), ordinal (e.g. "large", "medium" or "small"), integer-valued (e.g. the number of occurrences of a part word in an email) or real-valued (e.g. a measurement of blood pressure)."
We have started to transform any sense to a numerical equivalent so we can simulate, sounds, visuals, etc. But it is still not always easy to write (talk/) about something in a consistent way. There are so many synonyms, and the synonyms are sometimes come from the different faculties (like different languages, different habitats).
Philosophy
We might not think (talk) about it today, but eventually we will come to take it for granted that Everything!, can be built on the building blocks of Philosophy. The catogories of what we can know; Epistemology, Ontology.
I believe the highest value lies in the sensory feeling, and for both the individual and the total collective - a form of aesthetic (with Rawls ethics; like if roles were switched). Aesthetics has two dimension; the efficient and the effective. The true "beauty" lies in efficiency effectiveness; any life form is such an example, and the ultimate beauty lies in the expression and co-existence of all and any possible life forms. Efficiency to continue the longest; with lest amount of resources (energy(E)/material(m)/time/space/...). Note: Machine learning to find correlations like E=mc2. Ethics are our guides (to learn); to do right, and the feedback to do right the next time. I am thinking that juridical (machine learning) system should be built on the outcomes/values we seek. Picture: Sensors transforms something unknown to known; real to meta (source)
Picture: Fundamental logic without a standard (source)
A Cluster is commonly visualised as a 2-dimensional correlation (but could be any dimensional correlation). Observation set into sub-sets (slide88). Note that every evolution (development) start as an anomaly, from the norm. So we need a anomaly detection system that values the anomalies an something precious.
Following the same logic, things can be defined to have a value or not.
Scalars, has a scaled value (bigger/smaller)
----- Self service
Empower means to give
+ Resources
+ Time (a kind of resource)
+ Motivation
a) vision of a product (as a resource)
b) vision of a product (as a feeling; from sense to sensation)
I believe in individual freedom as long as it does not intrude on any other person (life forms; within reason).
-----
Type of Patterns:
* Classification, Cluster/Groups
* Hierarchies (of clusters)
* Measures (purpose to be used for arithmetic) or Dimensions (...could be counted, or sequenced) Picture: Classification (define), Clustering (meaning), Regression (prediction) - slide16
Picture: Supervised/unsupervised learning
Supervised ML = Predict the future. We know what we are going to learn = What is True
Un-S.ML = Understand the past. Find patterns/categories
For process mining, we have a slightly different meta model in mind because we look at the data from a process perspective.
One event is an activity that was executed in the process (process step).
Events are grouped to a case, and linked together in a process instance, or case.
So each case forms a sequence of events—ordered by their timestamp.
To summarize, all you need are data that can be linked to a case ID, activities, and timestamps. It does not matter where these data come from (ERP, CRM, workflow logs, ticketing system, PDM, HIS records, legacy log files, and so on), and you don’t need a BPM system with pre-modelled process models to get started with process mining. The actual process:
---
---- Weka is a collection of machine learning algorithms for data mining tasks. The algorithms can either be applied directly to a dataset or called from your own Java code. Weka contains tools for data pre-processing, classification, regression, clustering, association rules, and visualization. It is also well-suited for developing new machine learning schemes. ---- Good summary
Picture: How to get data from the tabs: source Instead of the usual way: Source = Web.Page(Web.Contents("http://financials.morningstar.com/ratios/r.html?t=MSFT
Use this M-code: let Source = Text.FromBinary(Web.Contents("http://financials.morningstar.com/financials/getKeyStatPart.html?&t=XNAS:MSFT")), A = Text.Replace(Source, "\", ""), B = Text.Replace(A, "display:none", "display:block"), C = Web.Page(B), Data = C{6}[Data], D = Table.TransformColumnTypes(Data,{{"Efficiency", type text}, {"2015-06", type number}, {"2006-06", type number}, {"2007-06", type number}, {"2008-06", type number}, {"2009-06", type number}, {"2010-06", type number}, {"2011-06", type number}, {"2012-06", type number}, {"2013-06", type number}, {"2014-06", type number}, {"TTM", type number}}), E = Table.DemoteHeaders(D), #"Transposed Table" = Table.Transpose(E), #"First Row as Header" = Table.PromoteHeaders(#"Transposed Table"), #"Renamed Columns" = Table.RenameColumns(#"First Row as Header",{{"Efficiency", "Period"}}), #"Added Custom" = Table.AddColumn(#"Renamed Columns", "Ticker", each "MSFT"), #"Reordered Columns" = Table.ReorderColumns(#"Added Custom",{"Ticker", "Period", "Days Sales Outstanding", "Days Inventory", "Payables Period", "Cash Conversion Cycle", "Receivables Turnover", "Inventory Turnover", "Fixed Assets Turnover", "Asset Turnover"}) in #"Reordered Columns" ------ Power-Query Tips * How to Custom-Sort a Table = Table.Sort(#"Renamed Columns", each List.PositionOf({"infrastrukturTable", "finansTable", "naturTable", "manniskorTable"}, [Area])) * How to Combine Records = Table.AddColumn(Coordinates, "Custom.1", each Record.Combine({[#"http://Column1.properties "],[Custom]})) ------------