Source: https://www.slideshare.net/oliviertravers/microsoft-power-stack-2017
PowerQuery
DataSources --> Transformations
1. Clean;Extract/Transform --> 'Data-Table'
2. Categories/Measures/Relations --> 'Info.-Table'
3. Restrictions/Access-Roles -->'Acc.-Table'
----
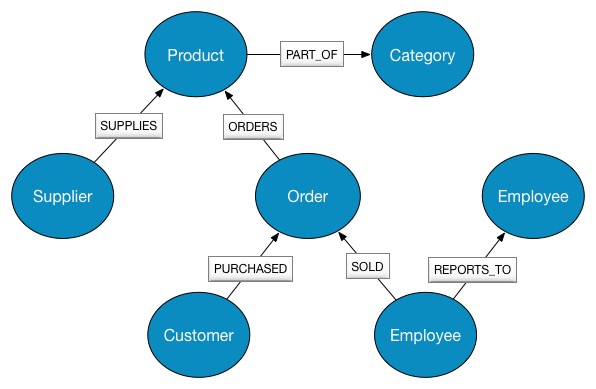
SQL-Server 2017: Drill Down + Graph-Model
1. NorthWind: Relational-Model --> Graph-Model
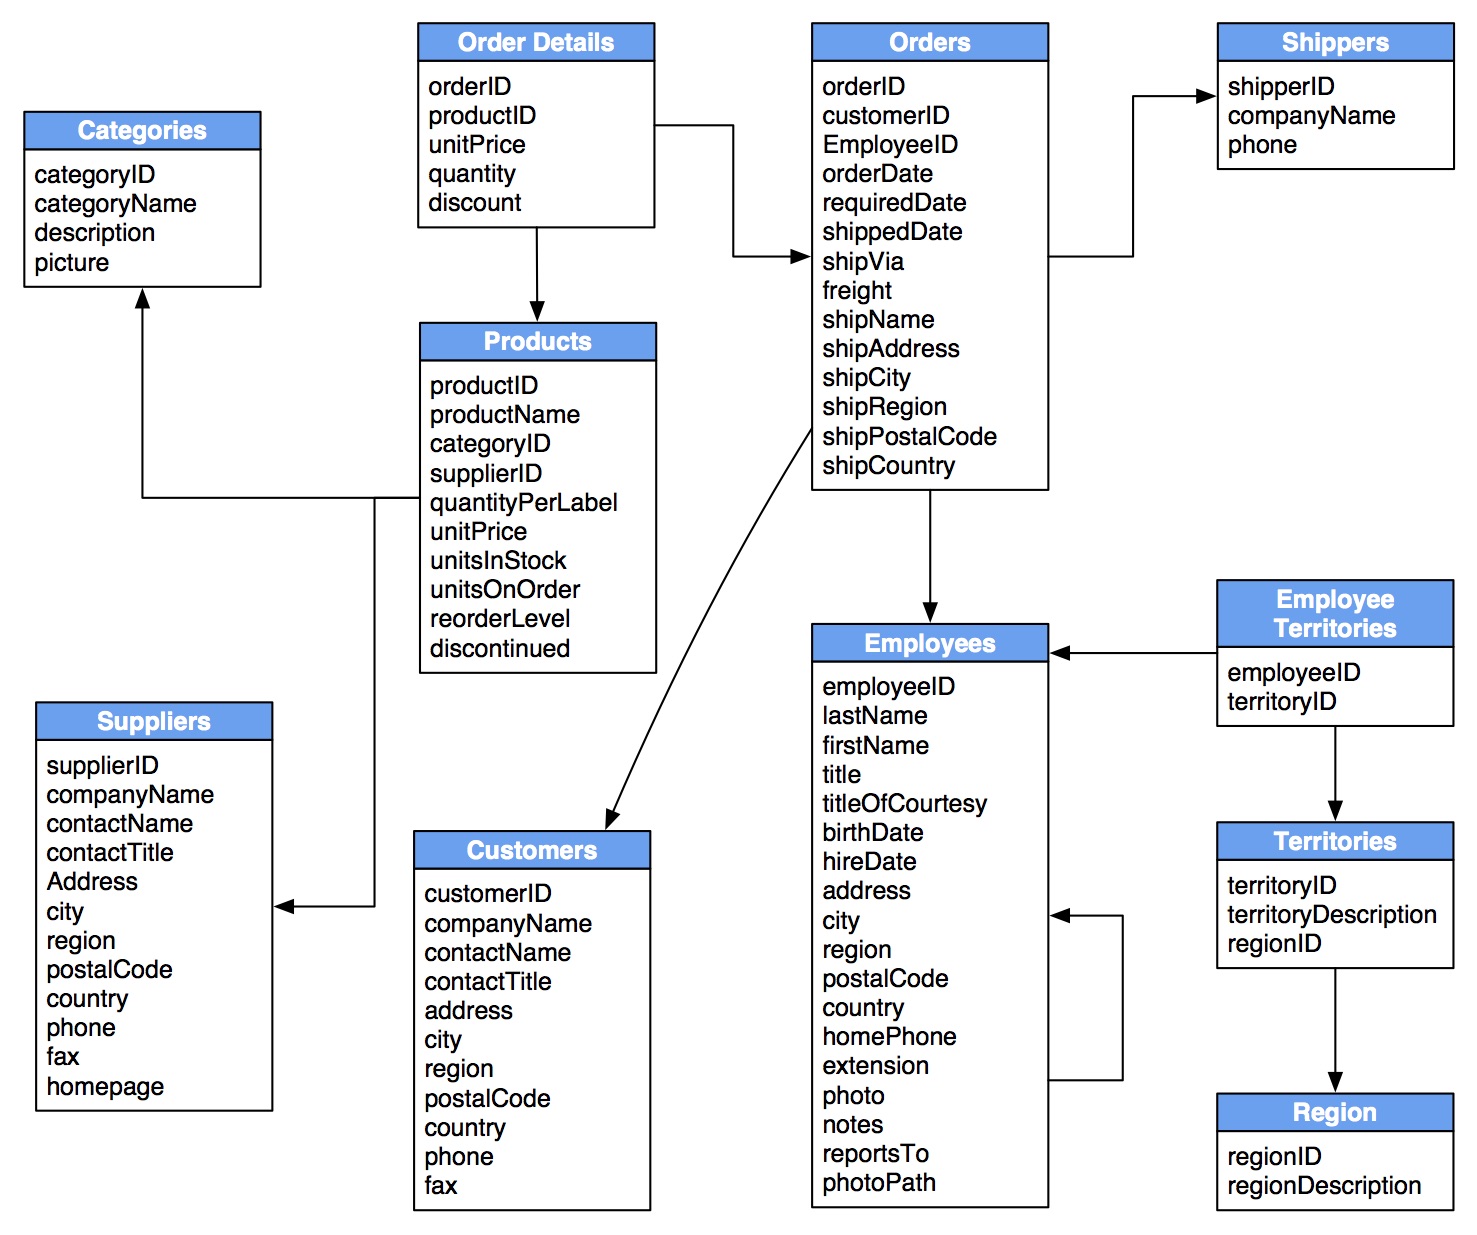
2-4. Foreign keys becomes Relationships, Join-Tables become Relationships, Attributes...
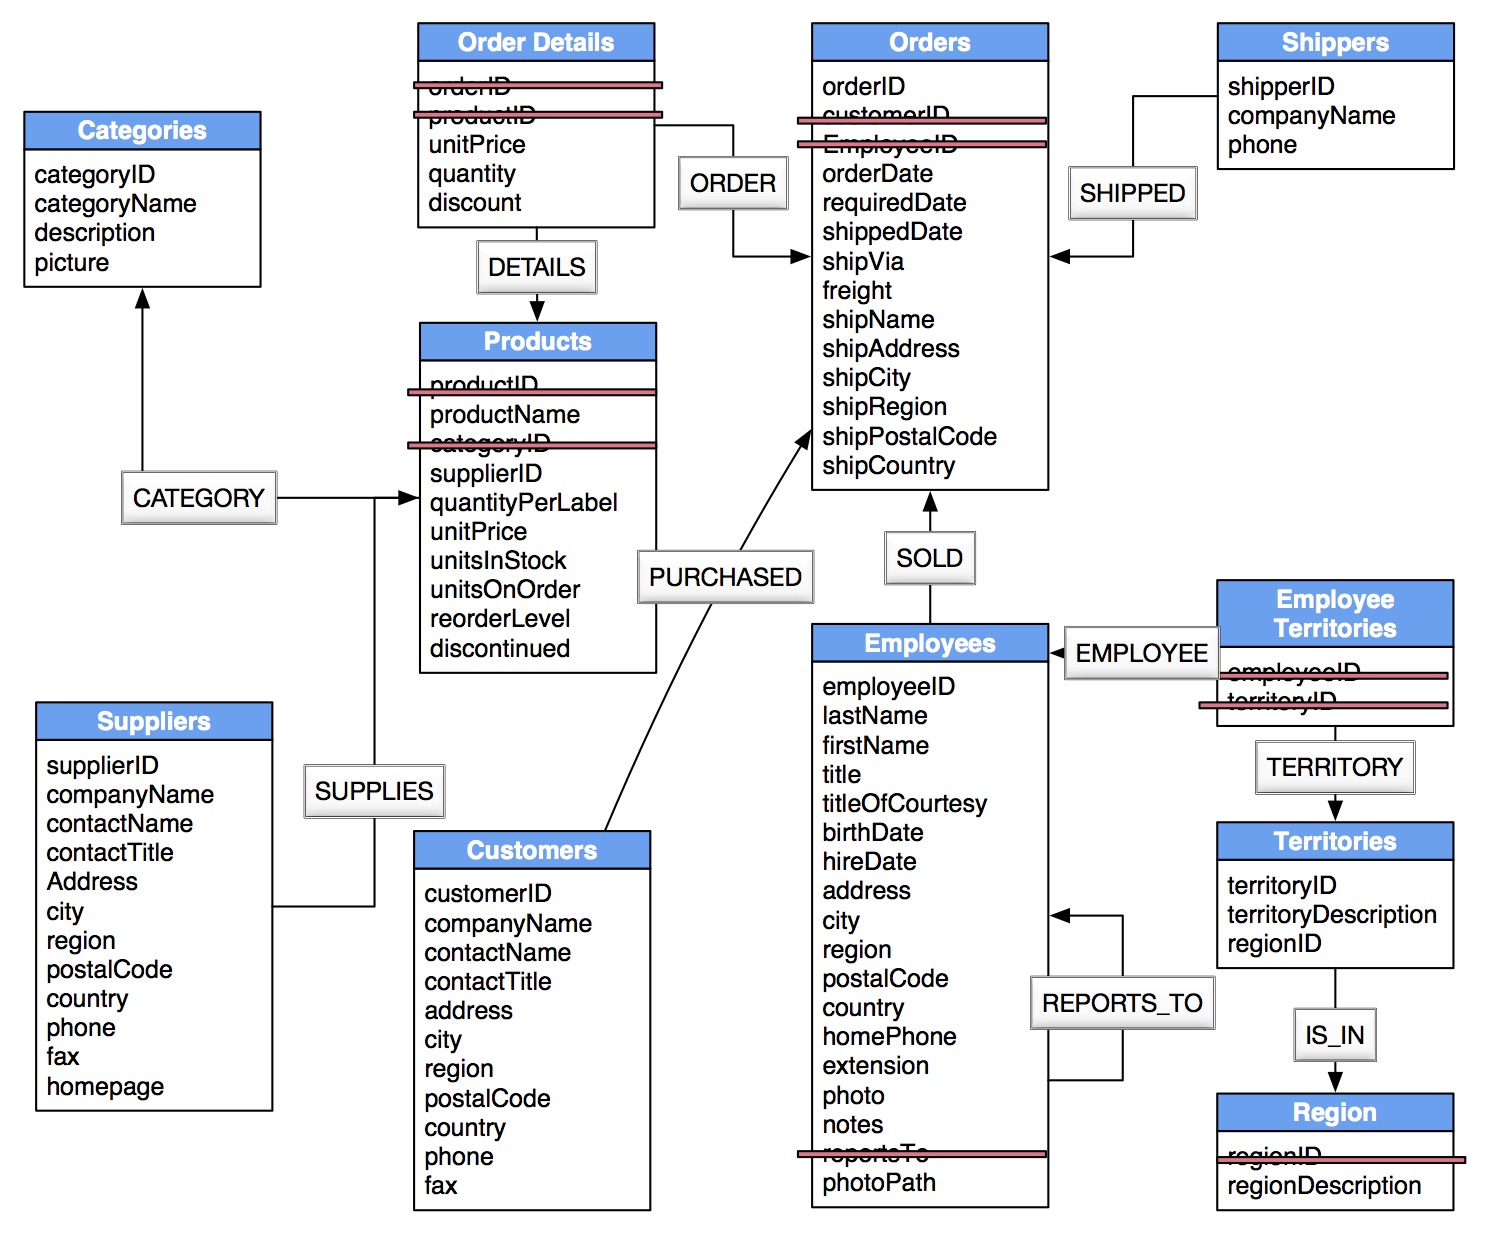
5. Graph