lördag 25 april 2015
lördag 11 april 2015
Power BI Designer & Analytics
Power Query Function example video
Power BI summary, recommendations
Power BI Designer review
Power BI Designer: 5 play list
How to AutoRefresh Excel data via O365.
Video:
1. Create Tabular Cube with SQL Server, Analysis Services, Tabular Model
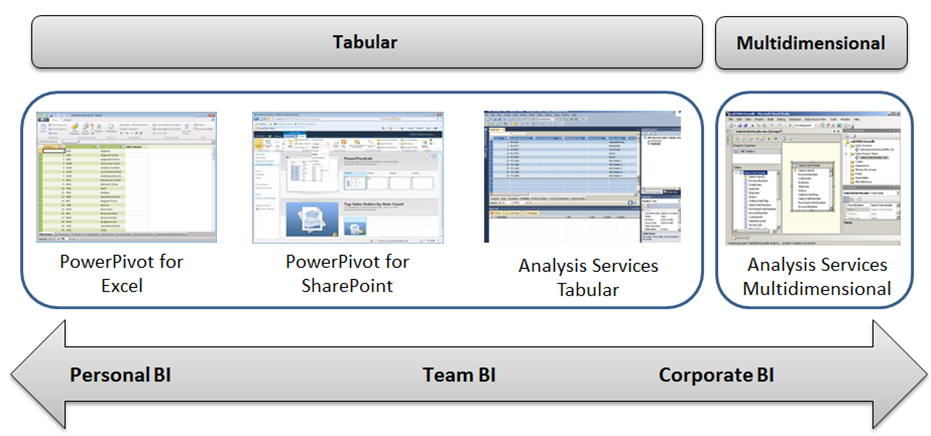
2. Scaling from PowerPivot (XL) --> PowerPivot (SharePoint) --> SSAS, Tabular Model -->
BI and statistics: link to video
lördag 14 mars 2015
Combining Arrays - UDF
=CombineArray()
and...
=CHOOSE({1;2},TRANSPOSE(List1),TRANSPOSE(List2))
File: http://www.interactiveds.com.au/software/CombineArray.xls
Source: link
and...
=CHOOSE({1;2},TRANSPOSE(List1),TRANSPOSE(List2))
File: http://www.interactiveds.com.au/software/CombineArray.xls
Source: link
lördag 14 februari 2015
PowerPivot & DAX functions
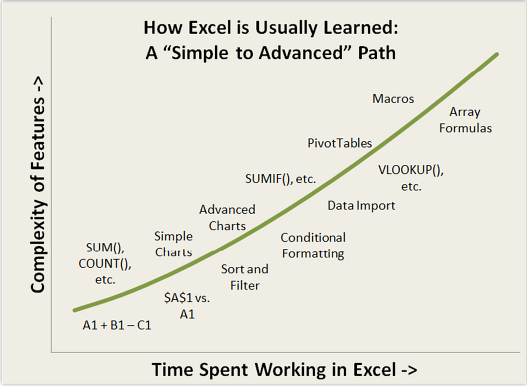
The step between Excel and DAX functions is surprisingly small.
Print this Summary of DAX functions + cheat sheet + 2016 functions. 95% are the same functions.
New functions RELATED(), FILTER(), or here.
Learn via...
Videos: CALCULATE(), Microsoft
Forums: MrExcel, StackOverflow,
Articles: FILTER() vs CALCULATETABLE(), DAX Patterns
Extra
DAX Studio, create measures,
SQL-Server: PowerPivot/DAX in SQL server,
Enabling Tableau to read PowerPivot
To be clear, you are not connecting to the Excel pivot table, but to the underlying PowerPivot model.
CALCULATE(): Any FILTER() in a CALCULATE statement overrides the existing PivotTable selection (for the columns it contains). If we don’t want to loose the existing PivotTable selection, we can use VALUES() instead of ALL().
DAX Studio
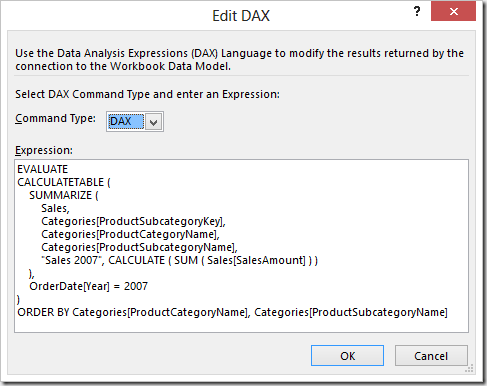
EVALUATE
Your OutputTable
EVALUATE
ROW ("Result", Your OutputMeasure)
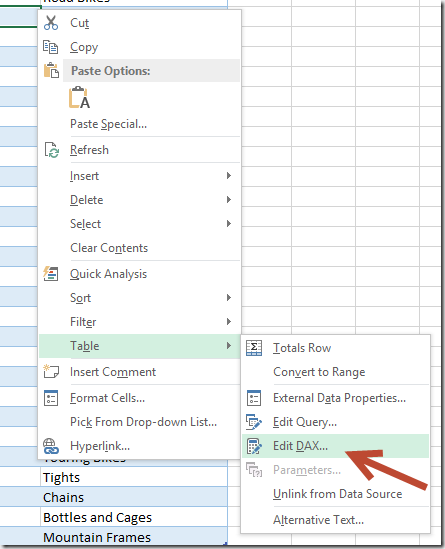
Hidden DAX-editor in Excel
Enables AutoRefresh (histogram example)
Compare SQL, MDX, DAX
Simple example
DAX joins
Measure(SourceValue;ForeignKey) by Dimension(Related;Key)
=INDEX(Source;MATCH(RelatedKey;ForeignKey;0))
=VLOOKUP(ForeignKey;SourceTable;ForeignKey/Col.;0)
Source: Book
måndag 8 december 2014
söndag 16 november 2014
Gartner BI-Survey 2014 + Tableau v.s. Qlikview
BI Survey 2014 by Gartner: Summary by Jen Underwood
2014 Comparison: Tableau v.s. Qlikview
lördag 15 november 2014
Business Decision Architecture & Microsoft Machine Learning
They've almost discovered the full picture ;-)
1. Resource Management: SQL-server (Gartner)
2. Process Management: Power Query/Pivot, Excel, R
3. Presentation Management: Tableau, Power View/Map (not ready)
Machine Learning (MAML)
Why care: Microsoft's Bing predicted midterm election with 95% accuracy
How ToDo: Getting Started on Azure Machine Learning Build a "Data Service", Blog, 2 (with VB)
TED: Where are we today, Kaggle, 2, blogg, tools used
Unpublished: Modular 3D Printer
1. Resource Management: SQL-server (Gartner)
2. Process Management: Power Query/Pivot, Excel, R
3. Presentation Management: Tableau, Power View/Map (not ready)
Machine Learning (MAML)
Why care: Microsoft's Bing predicted midterm election with 95% accuracy
How ToDo: Getting Started on Azure Machine Learning Build a "Data Service", Blog, 2 (with VB)
TED: Where are we today, Kaggle, 2, blogg, tools used
Unpublished: Modular 3D Printer
Prenumerera på:
Inlägg (Atom)