söndag 28 februari 2016

Create Tables with List.Generate() + Dynamic Measures + DataDictionary + Many2Many

Useful formula

List.Generate(()=>0,  //Start from 0
  each  _  <10 comment-10--="">
  each  _  +1 )       //add +1

Source: link

---------


Source: Dynamic Measures

---------
Links

Sentiment Analysis with PowerBI (source) - It works but the Quality is ...

Create a DataDictionary + Relationships

Many2Many relationships

AND logic to Slicers

------------------
MeetUps (Stockholm): PowerBI, R, BioHackers, ...

lördag 27 februari 2016

DAX: Count Active Contracts Between(StartDate; EndDate)


Active Contracts:=CALCULATE(COUNTROWS(Contracts);
    FILTER(Contracts; ('Contracts'[StartDate] <= LASTDATE('Date table'[Date])
                              && 'Contracts'[EndDate]>= FIRSTDATE('Date table'[Date]))))

Table1: DateTable (auto-generated with Power Query)... source=first date, last date becomes today
Table2: ContractTable (Contract, StartDate, EndDate)
No links/joins

Sources: ExcelFile, Count active contracts, Auto-generate DateTable

----

Difference between SUM/SUMX/CALCULATE

Mes;= SUM( Tbl[Revenue] )   //Single Column

X-Formulas iterates on a Table and evaluates the expression for each row.
Revenue := SUMX( Sales; Sales[Price]*Sales[Quantity] )
Note: The columns must all be from the same table, or use Related if there is a relationship.

Cost1 := SUMX( Dati; Dati[Cost] * Dati[Quantity] )
Cost2 := SUMX( Dati; FILTER( Dati; Dati[Quantity]>10; [Cost] * Dati[Quantity] ) )


Picture: Row context or Filter context (from PivotTable) - link


Picture. slide52


Incorrect: Mes:= CALCULATE( SUM(...); Tbl[Col1] > Tbl[Col2] )  //Two col.
Correct  : Mes:= CALCULATE( SUM(...); Tbl[Col1] > 10 )              //One col.
Correct  : Mes:= CALCULATE( SUM(...); FILTER( Tbl; Tbl[Col1] > Tbl[Col2] ))  //Two col.

Picture: slide40


Picture: slide48

--------

VALUES


Picture: slide47


----
RANKING FORMULA
--> Ranking: 1, 2, 3, ....

ALT.1: With EARLIER()
RankingOnUnitPrice =
COUNTROWS (
      FILTER( ALL('Product');
                       'Product'[UnitPrice] > EARLIER ( 'Product'[UnitPrice]
                     )
       ) + 1

ALT.2: With VAR
RankingOnUnitPrice =
VAR
      CurrentUnitPrice = 'Product'[UnitPrice]
RETURN
COUNTROWS (
             FILTER( ALL('Product');
                             'Product'[UnitPrice] > CurrentUnitPrice
                           )
                         ) + 1

Video: The original name of EARLIER() was OUTER(); it gives you access to the Outer row Context - the previous iteration.

ALL() --> Does not look at the values, instead looks at all rows.

----
DYNAMIC GROUPINGS

Picture: (source + excel-file)

ALT1: with VAR
"Variables also has the advantage of evaluating the expression once so the expressions that reference them should perform better.". Key formula SWITCH(TRUE())

NumberOrders =
VAR SumOrders =
CALCULATE ( DISTINCTCOUNT ( FactInternetSales[SalesOrderNumber] ) )
RETURN
SWITCH (
TRUE (),
SumOrders <= 4, FORMAT ( SumOrders, “General Number” ),
SumOrders >= 5 && SumOrders <= 10, “5-10”,
SumOrders > 10, “More than 10”
)

Alt2: without VAR
"If you don’t have a variable, you need to create a separate measure for CALCULATE ( DISTINCTCOUNT ( FactInternetSales[SalesOrderNumber] ) ) and use this measure so you don’t repeat the same formula in the SWITCH statement."

Slicers for value fields

-------- VAR & RETURN FORMULA
DAX now has variable support

----
CALCULATE
CALCULATE() is the only formula that can modify/replace (an exisiting column filter) a Filter Context (video). But not other column filters. Example a table with Colour="Red", but not Size

Alt1: RedSales = CALCULATE( Product[SalesAmount]; Product[Color]="Red")
--> same amount on every row.
Alt2: RedSales = CALCULATE( Product[SalesAmount]; FILTER(Product; Product[Color]="Red"))
--> only on the red row.
Video


----
DISTICTCOUNT of a UNION
Measure = var a = UNION(Table2,Table3) 
return 
COUNTROWS(
summarize(a,Table2[Col1])
)

Resources consumed...
Time (CPU)        : Calculated Measures
Space (Memory) : Calculated Dimensions  (Columns)

Pareto
If,  ~80% comes from 1 variable
--> >90% comes from 2 variables ?

---
Getting started with DAX Studio


-----
COMBINE EXCEL FILES

Combine data from several Excel sheets

lördag 20 februari 2016

Gartner - BI & Analytics leaders

Tableau
Picture: Movement Year by Year. Source: link

Power-BI


Link to the Dashboard, until the Embed code starts to work
Similar but better by Fredrik Hedenström
A great Showcase, blog-post, video1, 2 (twitter)
----
2016 trend: Scrollytelling (storytelling by scrolling) - example

lördag 3 oktober 2015

Excel Machine Learning (add-in)

Machine Learning inside Excel.

Try without installing:

Source: Jen Underwood tweet


What is Machine learning ?


'Deep learning (neural networks)' 

Link: Twitter flow, Machine Lerning


Machine learning


1. Take a small sample, 2. train it to cluster, 3.


Link: Best Cheat sheets


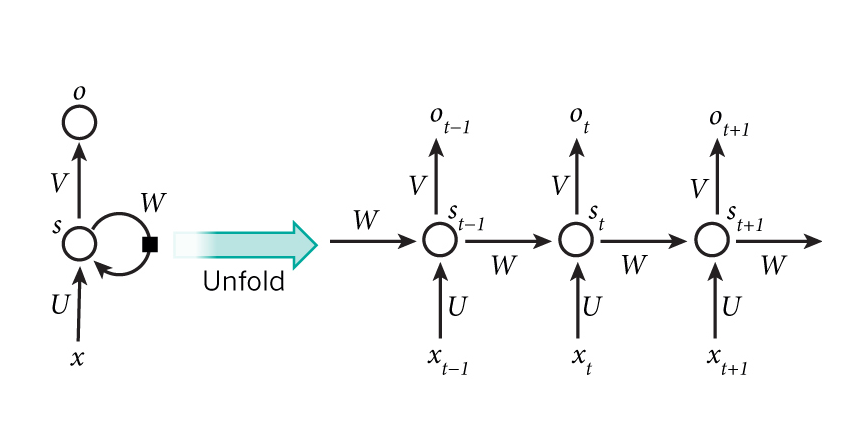
Recurrent Neural Networks (RNN) - one of many neural network patterns.
"The idea behind RNNs is to make use of sequential information. In a traditional neural network we assume that all inputs (and outputs) are independent of each other. But for many tasks that’s a very bad idea. If you want to predict the next word in a sentence you better know which words came before it. RNNs are calledrecurrent because they perform the same task for every element of a sequence, with the output being depended on the previous computations. Another way to think about RNNs is that they have a “memory” which captures information about what has been calculated so far. In theory RNNs can make use of information in arbitrarily long sequences, but in practice they are limited to looking back only a few steps (more on this later). 

Here is what a typical RNN looks like:
Embedded image permalink

Semantic analysis: http://news.mit.edu/2015/more-flexible-machine-learning-1001
Cheat sheets: * http://designimag.com/2015/06/best-machine-learning-cheat-sheets/

Cortana gallery: https://gallery.cortanaanalytics.com/

Other
* Power BI Custom Visualisation Competition - Developer tools, Start page
* http://thevisualcommunicationguy.com/wp-content/uploads/2015/06/Infographic_RulesOfPunctuation1.jpg

torsdag 2 juli 2015

PowerQuery: Combine files & Promote Headers + fnSWITCH() + Alternating rows

image_thumb26
Picture: Add a column: =Excel.Workbook([Content])
Source: link


Smart solution to a common problem.
Link


Insert BlankQuery: fnSWITCH()

(input) =>
let values = { {result_1, return_value_1}, {input, "Undefined"} },
Result = List.First(List.Select(values, each _{0}=input)){1}
in Result

Link


Alternating rows


Retreive Named ranges
= Excel.CurrentWorkbook()  //finds all
= Excel.CurrentWorkbook(){[Name="MyRange"]}[Content]
= Files = Folder.Files(Source{0}[Column1]),                                    // Single value

----
Undocumented
BI/Analytics training

torsdag 14 maj 2015

PowerQuery: Input - Process - Output


Picture: Simple transformation (link). Note: FunctionToApply can be placed on any row.

Note:
Excel.CurrentWorkbook() = All named ranges
Table1 = Range name, selected
[Content] = All three columns, selected
Input{0}[Column1] = 1st cell in range Column1

lördag 25 april 2015

PowerQuery: Retreive several web-pages


(page as number) as table =>
let
    Source = Web.Page(Web.Contents("http://boxofficemojo.com/yearly/chart/?page=" & Number.ToText(page) & "&view=releasedate&view2=domestic&yr=2013&p=.htm")),
    Data1 = Source{1}[Data],
    RemoveBottom = Table.RemoveLastN(Data1,3)
in
    RemoveBottom


Link: http://www.mattmasson.com/2014/11/iterating-over-multiple-pages-of-web-data-using-power-query/