Link: Day1, Day2
PowerBI UserGroups Attachements, NorwayUserGroup
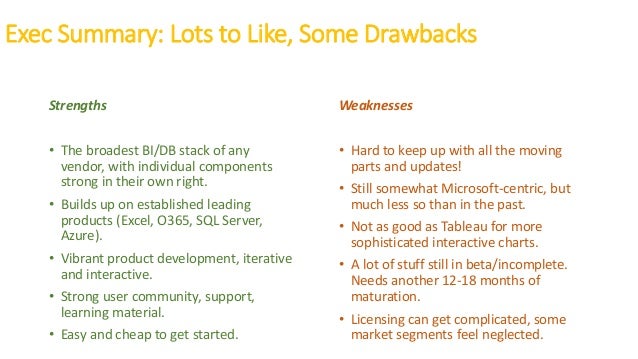
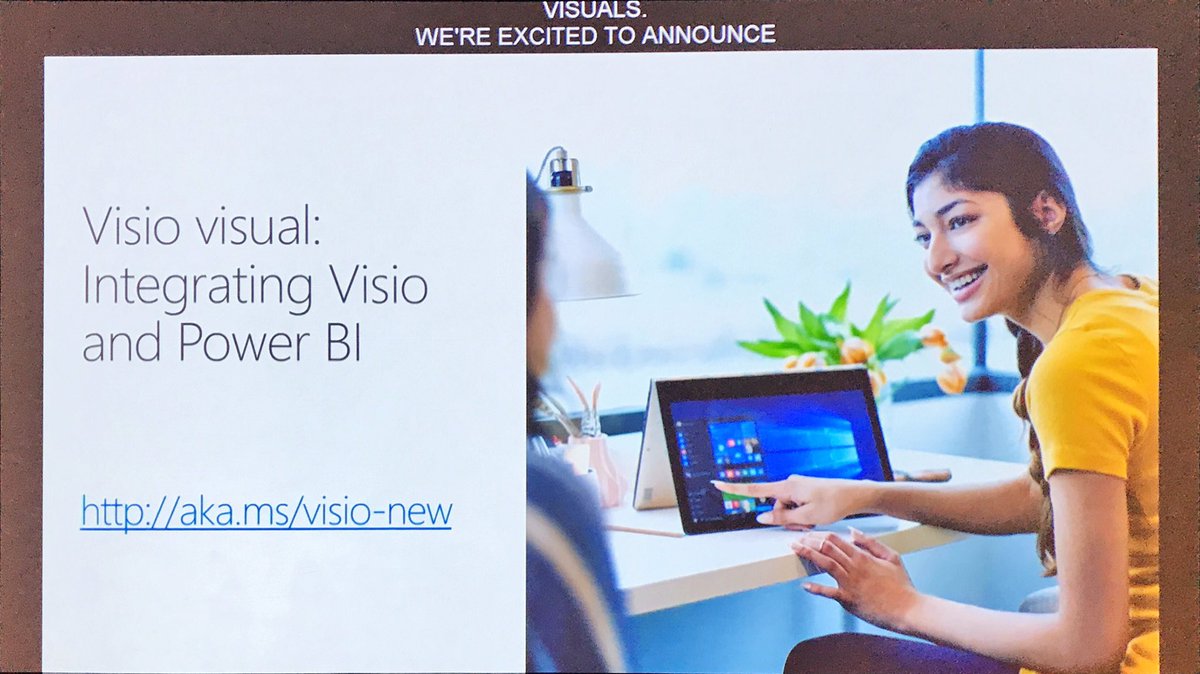
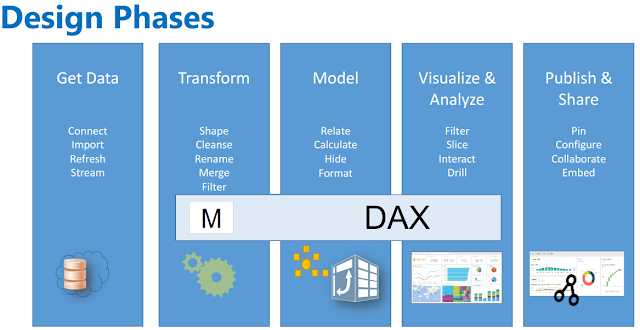
PowerBI & Visio

----
RatioToParent_Ordered:=
IF (
    ISFILTERED ( Product[HProduct] ),
    SUM ( 'Internet Sales'[Sales Amount] )
        / CALCULATE ( SUM ( 'Internet Sales'[Sales Amount] ), ALL ( Product[HProduct] ) ),
    IF (
        ISFILTERED ( Product[HModel] ),
        SUM ( 'Internet Sales'[Sales Amount] )
            / CALCULATE ( SUM ( 'Internet Sales'[Sales Amount] ), ALL ( Product[HModel] ) ),
        IF (
            ISFILTERED ( Product[HSubcategory] ),
            SUM ( 'Internet Sales'[Sales Amount] )
                / CALCULATE (
                    SUM ( 'Internet Sales'[Sales Amount] ),
                    ALL ( Product[HSubcategory] )
                ),
            IF (
                ISFILTERED ( Product[HCategory] ),
                SUM ( 'Internet Sales'[Sales Amount] )
                    / CALCULATE ( SUM ( 'Internet Sales'[Sales Amount] ), ALL ( Product[HCategory] ) )
            )
        )
    )
)
Link: 4 hierarchies
--
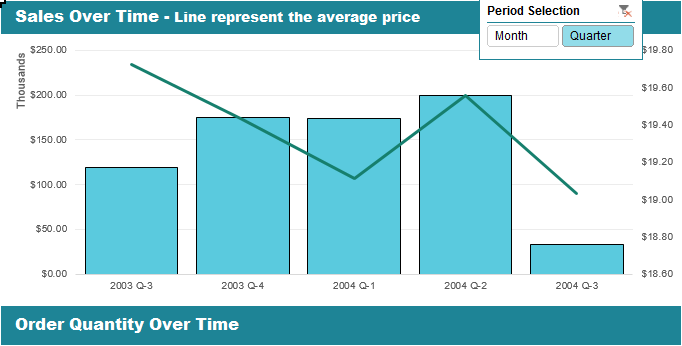
Slicers to Choose Which Measure to Display

Link
---
The Logic behind the Magic of DAX
Source
---
Other
* DAX+MDX files
* World Wide Importer db
* VBA Chart-arrows
* DAX Rolling 5yrs park
---

https://youtu.be/1yWLhxYoq88?t=2987
this one has a great chance to become my favorite video from #MSDataSummit where #PowerBI and Visio meet https://t.co/YYzt0cXMTz— Tom Martens (@tommartens68) June 14, 2017
---
Row Level Security In Power BI – Star Wars Challenge
https://datachant.com/2017/05/24/row-level-security-power-bi/
---
BOM database

http://www.thebiccountant.com/2017/06/13/bill-of-material-bom-explosion-part2-costing-in-excel-and-powerbi/
---
Use a "Reference" as "DB Connection".


---
Unpivot Nested Tables

----
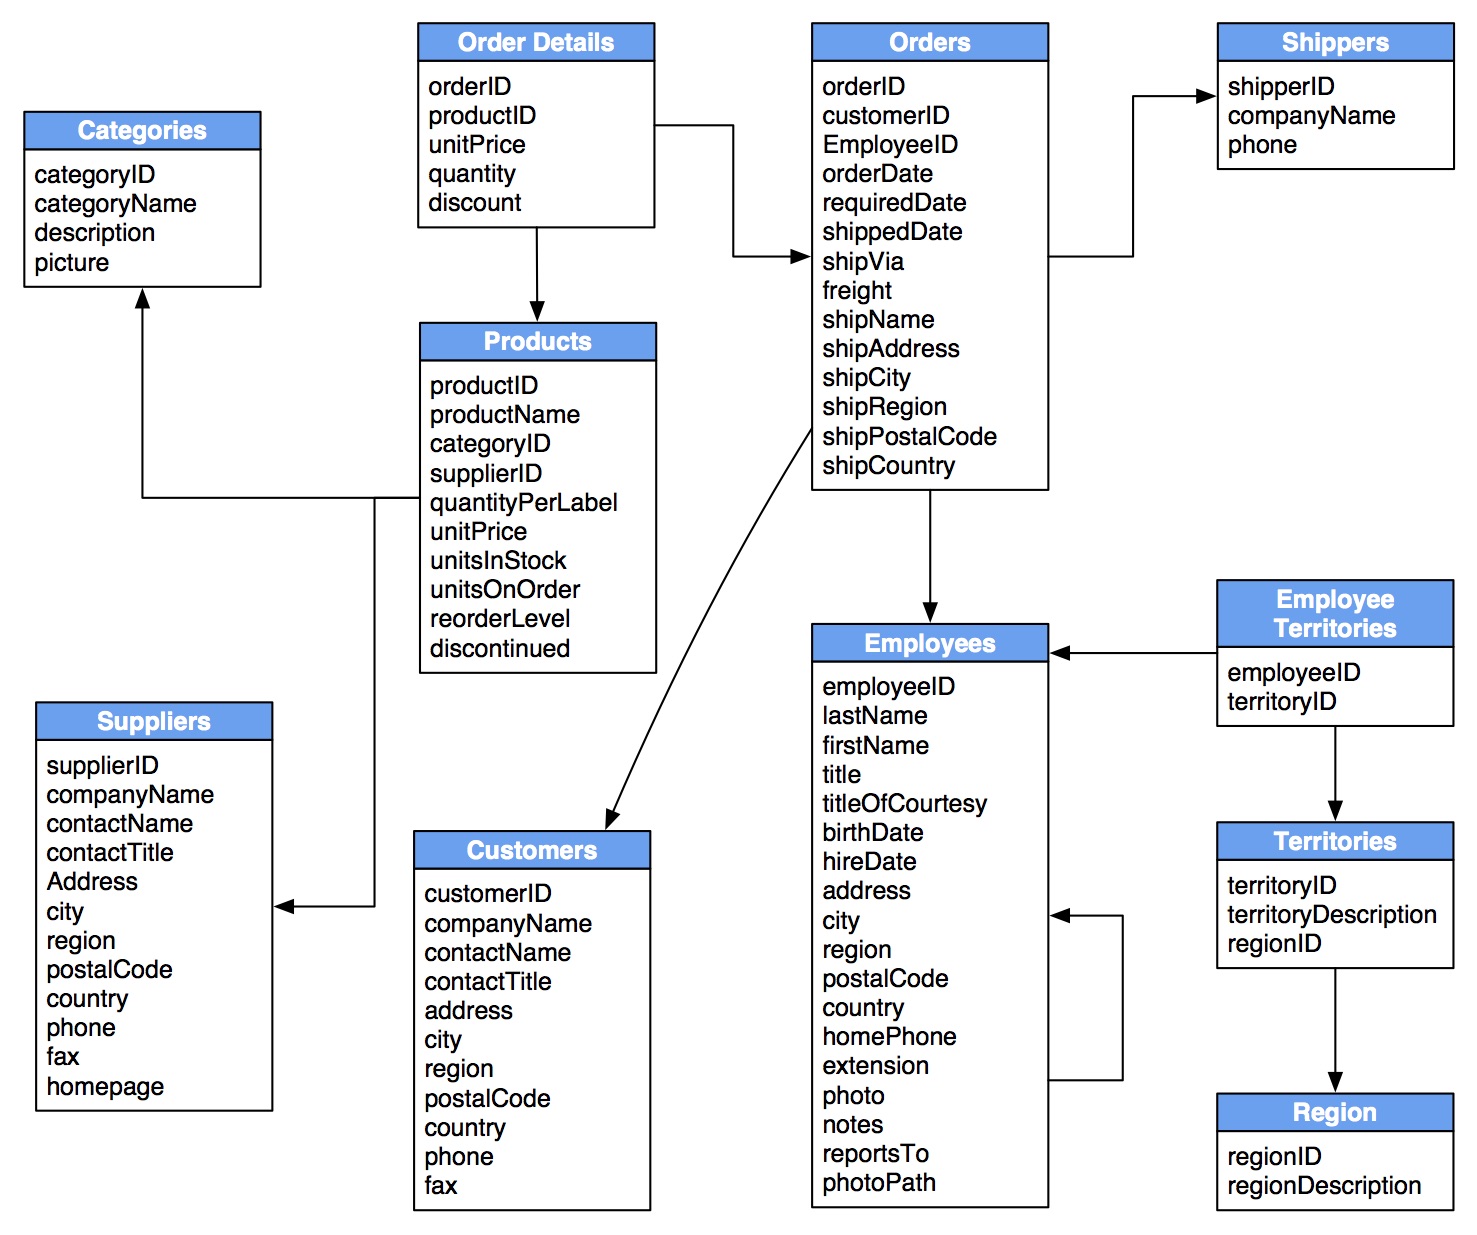
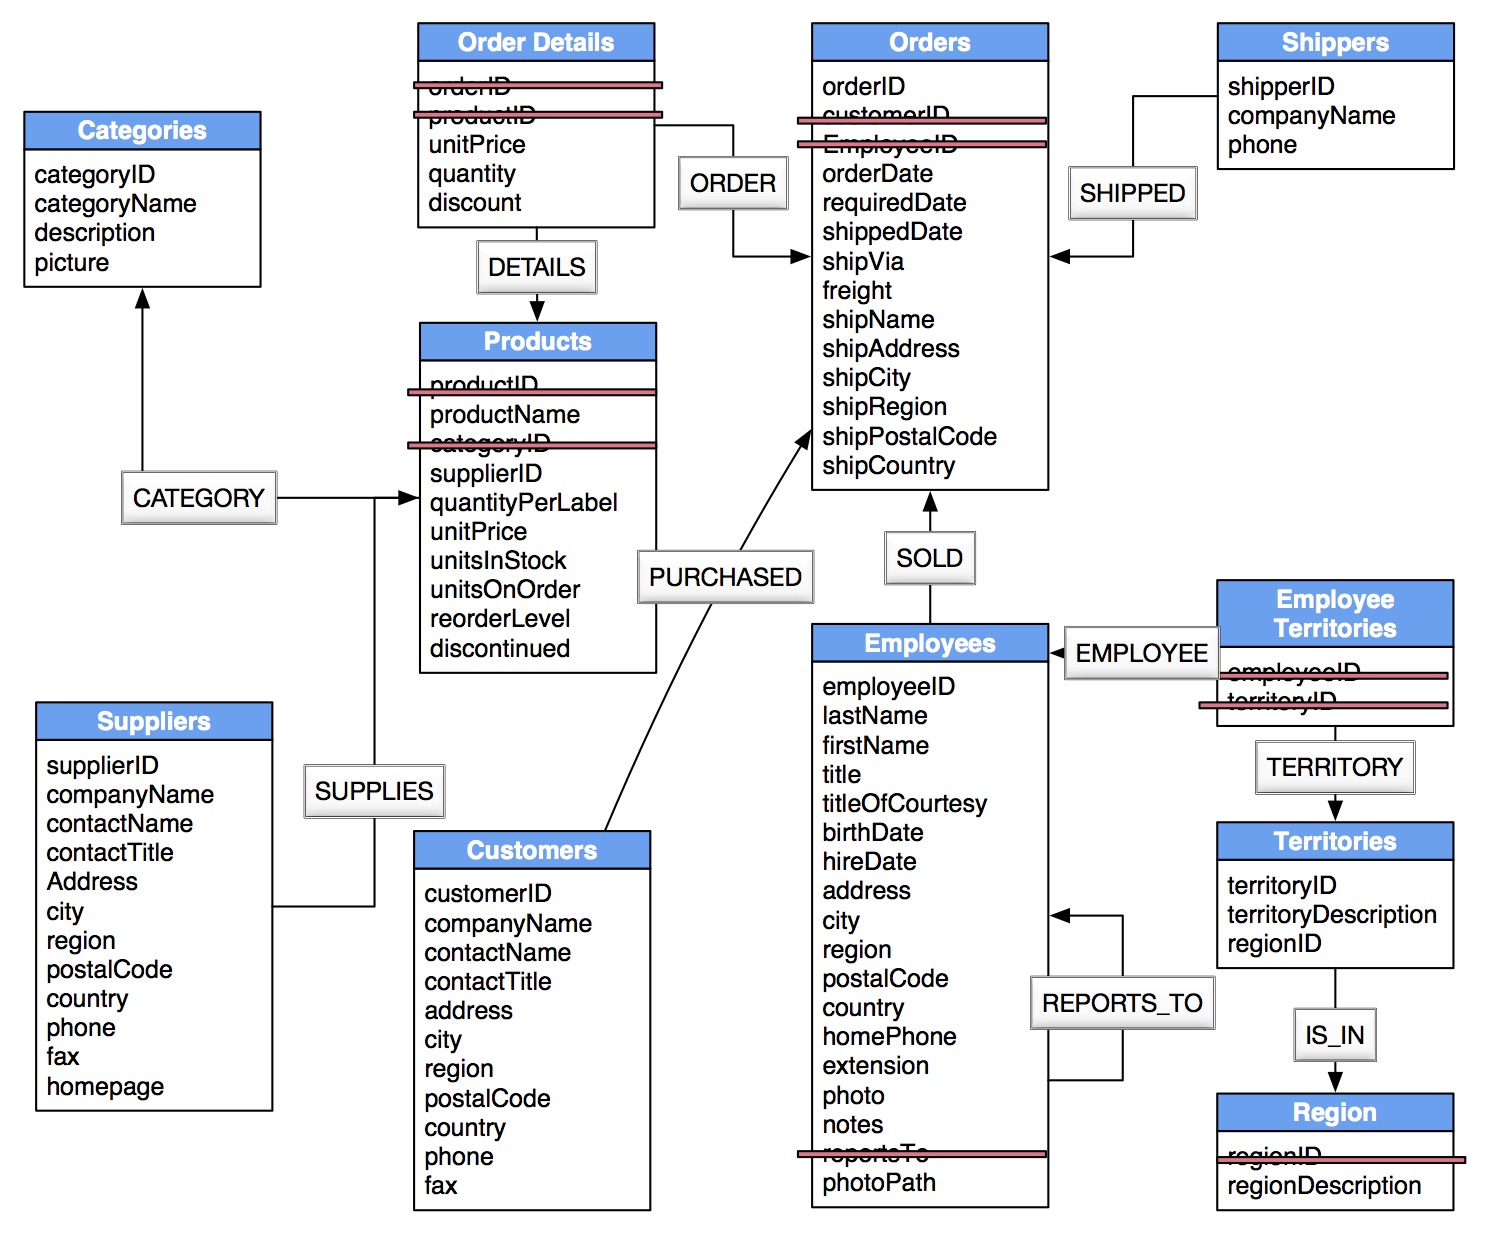
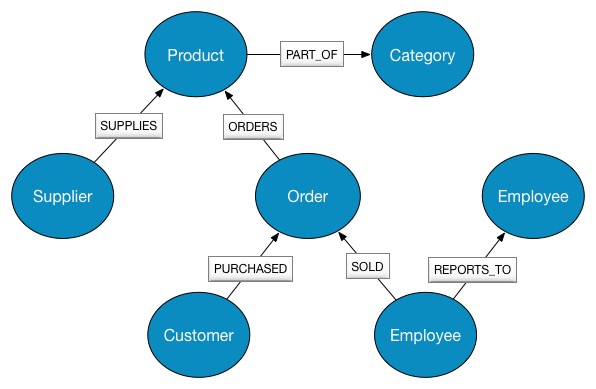
The Analytical process
Pic: Link


Pic: From MSDataSummit
Pic. pdf and the Interactive model
---
Measure Influencing Dimensions (resources)

Source: Intelligent Process Modeling and Monitoring with Visio and Power BI - YouTube
---
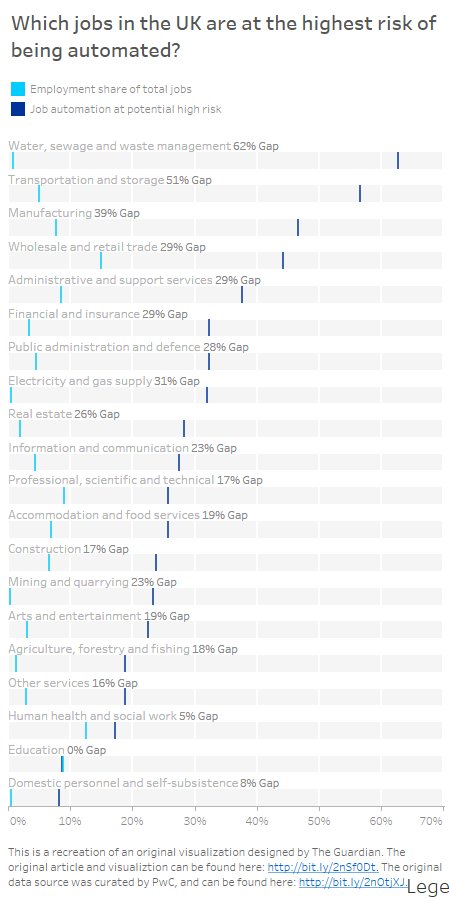
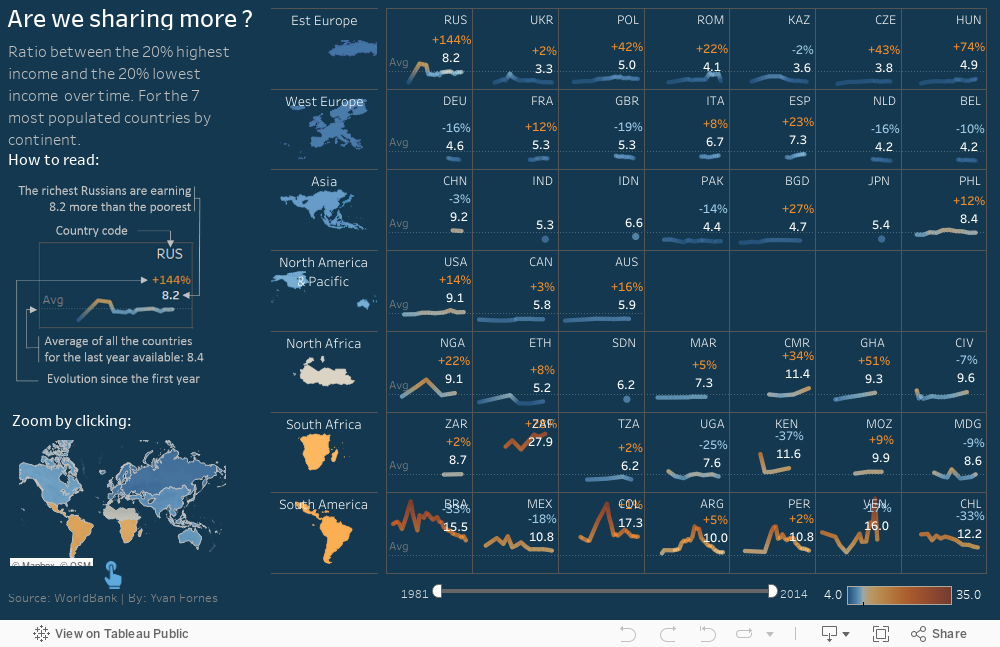
Democracy Indicator

---
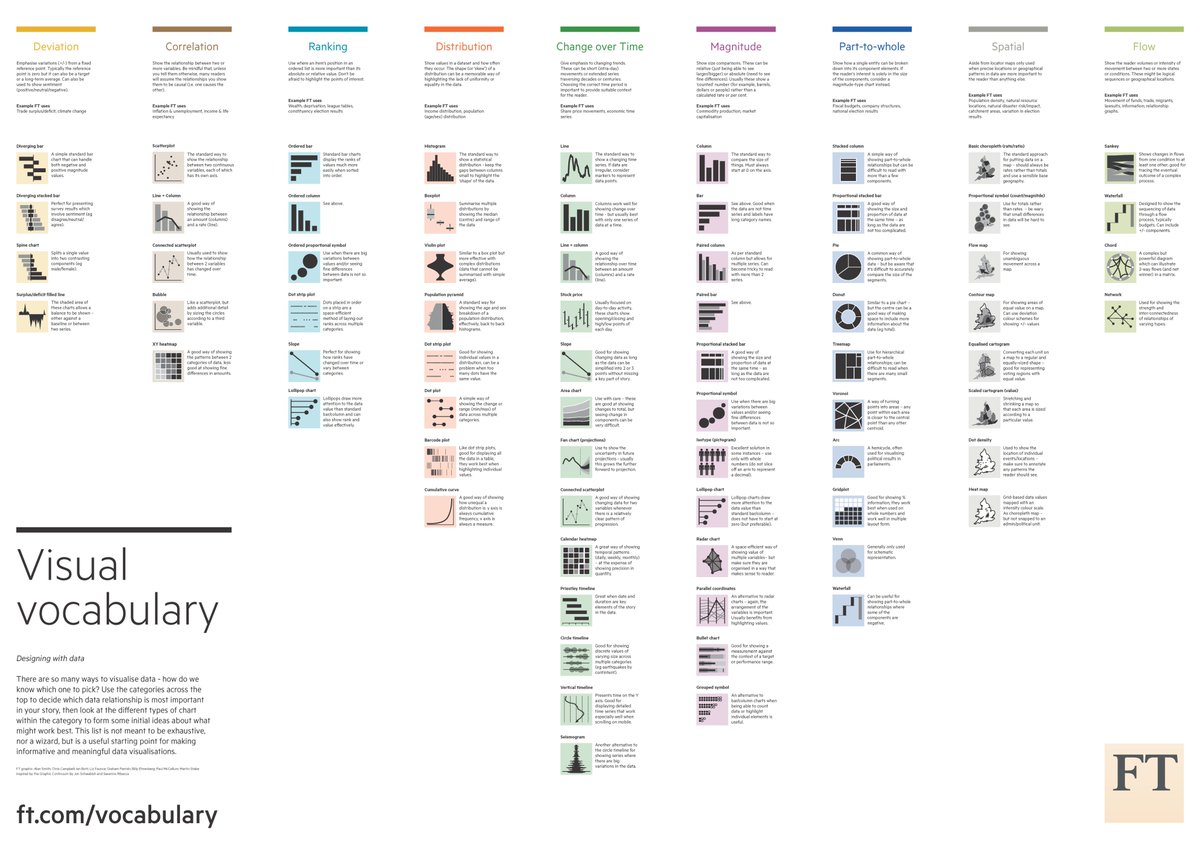
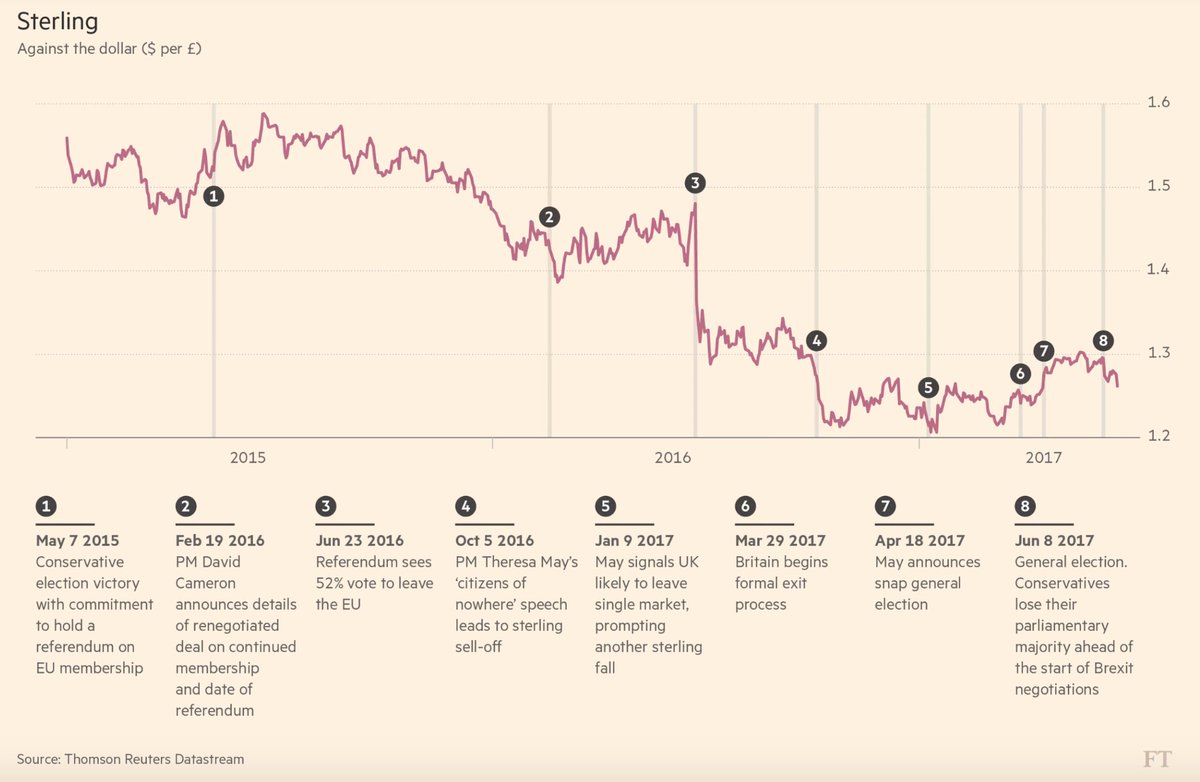
Make a story
----

Pic: Inside Europe’s biggest data visualisation laboratory. Imperial Collage London maps bitcon transactions across 64 screens (link)
---
---And for those of you with less time on your hands, here's the speedy version 🏃: pic.twitter.com/SJzqVEiFmP— John Burn-Murdoch (@jburnmurdoch) May 21, 2017
---
Trump Lies