
Picture: How to register a DataSource ?
This is Machine Learning:
What is ML


DataProcess: 1. Define Output, 2. GetData, 3. TransformData
FunctionProcess: 4. GetFunction, 5. TransformFunction (called TrainModel*), 6. EvaluateFunction
* based on the data
Example (linear regression):


Picture: How to learn ML
Picture: Video
and MS Research lab,

Picture: ggplot2 cheat sheet (in R-Studio)

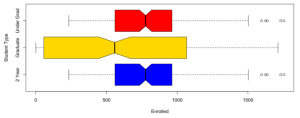
Picture: Distribution types
------
R links
Picture: Getting started with R, or A Complete tutorial

Picture: link (.pbix)
Examples: Sales data ggplot2 (.pbix), PowerBI ggplot2 (.pbix),
Videos: R in PowerBI (video), R with Jen (video), Videos
Download: R Tools for Visual Studio (download page, documentation), R-Quick.
Other: Forecasts
---------
Predictive Analytics

Picture: Link; To describe something well enough to be able to anticipate, and control something with a certain certainty.
---
Ternary Crosshairs

Picture: 3-variable detection
----
Community Detection Algorithms

Picture: closeness/betweenness comes from the igraph in R
----------------
Learn more
Twitter: Fredrik Hedenström, MS-BuckWoody, MS-PowerBI,
Azure Free Trial is not really free, Analytics Magazine
Top 3 R resources for beginners (Try R)
Learn R from Scratch
Inga kommentarer:
Skicka en kommentar